
American Samoa, at large
American Samoa, at large: the archive holds 15 results. In 2024, Aumua Amata Coleman Radewagen (Republican) won by 5,554 votes (56.2 points).
Results of every U.S. House race held in the archive, 1920 to 2024, from Federal Election Commission, Federal Elections and Clerk of the House of Representatives, Statistics of the Presidential and Congressional Election and MIT Election Data and Science Lab, U.S. House of Representatives 1976-2024 (compiled from the Clerk of the House). The winner is the candidate with the most votes. Where the source gives no count, the page says so. U.S. Senate results · Primary results · 2026 midterms
A district number is not always the same place. States redraw their districts after each census, and some redraw at other times. The results below are the history of the number (a state with one seat) in American Samoa, and may cover different ground from one decade to the next. The map shows today's boundaries only.
Latest results
U.S. House · 2024
American Samoa, at large
Final result
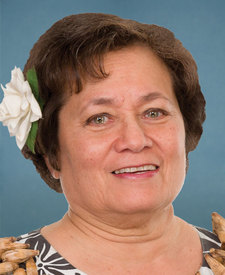
Won
Aumua Amata Coleman Radewagen
Republican
74.8%
7,394 votes
Luisa Kuaea
Democratic
18.6%
1,840 votes
U.S. House · 2022
American Samoa, at large
Final result
Won unopposed
Aumua Amata
Republican
100.0%
6,637 votes
U.S. House · 2020
American Samoa, at large
Final result
Won
Aumua Amata
Republican
83.3%
9,790 votes
Oreta Tufaga Mapu Crichton
Democratic
14.5%
1,709 votes
U.S. House · 2018
American Samoa, at large
Final result
Won
Aumua Amata
Republican
83.3%
7,194 votes
Tuika Tuika
Independent
9.3%
807 votes
Every result in the file
| Election | Winner | Runner-up | Votes, winner to runner-up | Margin | Notes | Cite |
|---|---|---|---|---|---|---|
| 2024 | Aumua Amata Coleman Radewagen Republican | Luisa Kuaea Democratic | 7,394 to 1,840 | 5,554 votes (56.2 points) | Result card · Cite this result | |
| 2022 | Aumua Amata Republican | None on the ballot | 6,637 | Unopposed | Only one candidate on the ballot, write-ins aside. | Result card · Cite this result |
| 2020 | Aumua Amata Republican | Oreta Tufaga Mapu Crichton Democratic | 9,790 to 1,709 | 8,081 votes (68.8 points) | Result card · Cite this result | |
| 2018 | Aumua Amata Republican | Tuika Tuika Independent | 7,194 to 807 | 6,387 votes (73.9 points) | Result card · Cite this result | |
| 2016 | Aumua Amata Republican | Vaitinasa Salu Hunkin-Finau Democratic | 8,923 to 1,581 | 7,342 votes (62.0 points) | Result card · Cite this result | |
| 2014 | Aumua Amata Republican | Eni F. H. Faleomavaega Democratic | 4,306 to 3,157 | 1,149 votes (11.2 points) | Result card · Cite this result | |
| 2012 | Eni F.h. Faleomavaega Democratic | Aumua Amata Constitution | 7,221 to 4,420 | 2,801 votes (21.4 points) | Result card · Cite this result | |
| 2010 | Eni F.h. Faleomavaega Democratic | Aumua Amata Republican | 6,182 to 4,422 | 1,760 votes (16.1 points) | Result card · Cite this result | |
| 2008 | Eni F. H. Faleomavaega Democratic | Aumua Amata Republican | 7,499 to 4,350 | 3,149 votes (25.4 points) | Result card · Cite this result | |
| 2006 | Eni F.h. Faleomavaega Hunkin Democratic | Amata Aumua Coleman Republican | 5,195 to 4,493 | 702 votes (6.4 points) | Result card · Cite this result | |
| 2004 | Eni F.h. Faleomavaega Democratic | Amata Aumua Coleman Republican | 6,656 to 5,472 | 1,184 votes (9.8 points) | Result card · Cite this result | |
| 2002 runoff | Eni F. H. Faleomavaega Democratic | Fagafaga D. Langkilde Independent | 4,959 to 4,083 | 876 votes (9.7 points) | Result card · Cite this result | |
| 2002 | Eni F. H. Faleomavaega Democratic | Fagafaga D. Langkilde Independent | 4,294 to 3,332 | 962 votes (9.3 points) | Result card · Cite this result | |
| 2000 runoff | Eni F. H. Faleomavaega (Democrat) | Gus Hanneman Party not given in the file | 5,500 to 3,505 | 1,995 votes (22.2 points) | Result card · Cite this result | |
| 1998 | Eni F. H. Faleomavaega Democratic | Seigafolava Robert Pene (None Declared) | 8,138 to 1,273 | 6,865 votes (68.2 points) | Result card · Cite this result |
All of American Samoa · The 2026 race for this seat
Download these results as a spreadsheet (CSV)
How this archive is built
- The file holds each candidate's vote total for each race. It has no winner column. The winner shown here is the candidate with the most votes in the race; if two are level at the top, the page says so and names no winner.
- Margin is the winner's votes minus the runner-up's. Points are that margin as a share of all votes counted in the race, including blank and scattered votes where the file has them.
- Two-party share is the Democratic candidate's votes divided by the Democratic and Republican votes together. It is only worked out when both parties had a candidate.
- Where the same person is listed on more than one ballot line (for example a party line and a joint line), the lines are added together.
- A race with one candidate on the ballot, write-ins aside, is marked unopposed. The file records some of these with a total of 1 instead of a vote count; the page shows "not published" for them, not 1.
- When a seat had more than one round in an election, the last round decides the seat: a runoff, then the general election, then a round the file labels "pre". The file's codebook does not define that label, so the page shows it as the file gives it.
- Special elections are listed beside the regular races for their year and are not counted in the seat totals.
- This page is about general elections and the runoffs that follow them. Primaries and primary runoffs are on the primary results page.
- Party names are the party lines the file gives. Candidates who ran on lines other than Democratic or Republican are shown as "Other party or independent" in seat totals. Independents who caucus with a party are not grouped with it.
- Names are written in capital letters in the file. The page changes only the case.
- For the years from the Federal Election Commission, each candidate row is the FEC's own, with general-election votes. The check figure is the total the FEC prints at the end of each race ("District Votes"). Where it prints none, the page says so.
- The FEC lists a candidate who ran on several party lines (New York, Connecticut, South Carolina and others) once for each line, and in some years also on a combined line. The page adds the lines together and drops a combined line so no vote is counted twice. The party shown is the line with the most votes.
- Write-in and scattered votes are shown as one row, "Blank, over and scattered votes", not as a candidate. A candidate the FEC lists as "Unopposed" with no vote count is shown as unopposed with the count "not published".
- The races counted for each year include the seats of the District of Columbia, American Samoa, Guam, the Northern Mariana Islands and the Virgin Islands, and Puerto Rico's resident commissioner, which the FEC lists beside the 435 state districts. Those members cannot vote on most questions on the House floor. The seats won by party count them too.
- In Louisiana (and Georgia, for the Senate) the first round and the runoff are separate rounds of one election. The runoff decides the seat.
- Where the FEC marks as winner a candidate who did not have the most first-choice votes (Maine's ranked-choice voting), that candidate is listed first, the votes shown are first-choice votes and no margin is worked out.
- Some seats were filled twice on one ballot: once for the new term and once for the rest of a term left vacant. The second is listed as a special election beside the regular race. The FEC calls them "full term" and "unexpired term".
- For the years from the Clerk of the House, each candidate row is a line the Clerk prints, with party names as printed. The check figure is the total the Clerk prints for the race: in its state recapitulation table, or on a "Total" line. A state's table is sometimes printed sideways over two pages, and for those races the page confirms only that the lines add up to a total printed in the state's table. Where the Clerk prints a total that does not equal its own lines, both are kept and the race is flagged.
- The Clerk prints "Under Votes" and "Over Votes" lines from 2020 on, and "Blank" or "Scattering" lines in some earlier years. They are shown in the one row "Blank, over and scattered votes". A race where the Clerk prints a footnote mark instead of a vote count (a candidate with no opponent, in the states that do not count such votes) is shown as unopposed with the count "not published".
- For 1976 to 1994, each row is from the MIT lab's file, which the lab compiled from the Clerk of the House's Statistics of the Congressional Election. The Clerk is the original source; this site has not checked these years against the Clerk's printed pages. Party names are as the file gives them, and a candidate on several party lines (for example in New York) appears once, with the lines added together.
- A district number is not the same place in every decade. States redraw their districts after each census, and some redraw at other times. District 7 in 1998 and District 7 in 2024 may cover different ground, so a district page is the history of a number, not always of one place.
Source for 2004 to 2022: Federal Election Commission, Federal Elections ↗, the Excel workbook the FEC publishes for each election (U.S. federal government work; no license text on the FEC pages). Fetched and checked November 5, 2026. The workbooks were read into one flat file; its SHA-256 is b331053c623e430a3acc12ff5daf50b81745b7d003d48254d3d47dfe94ce440e.
Each year's workbook
- 2004: fe2004.xls ↗, SHA-256
7960d845dac3ed67b61ee82e16c300ec3eb38ad4fd355532be0fe0848781f146; the FEC page for 2004 ↗ - 2006: fe2006.xls ↗, SHA-256
53c758cd83fa2a603d811ea1e2a3974baf703f1099d64b471cc8b6457b8d89f5; the FEC page for 2006 ↗ - 2008: fe2008.xls ↗, SHA-256
7ac35ceeaa27acca5e91f4048c025663bb4c8c770d3956e5093ecd54de524db5; the FEC page for 2008 ↗ - 2010: fe2010.xls ↗, SHA-256
0ce95daa33e5754221420d463eef7871f742135b5798e1194e1755315f9a9942; the FEC page for 2010 ↗ - 2012: fe2012.xls ↗, SHA-256
b92a2bd70e8b44d6c5eadc9cb8dc48c3a8d45bdbb029667b3bd874a66530b9e2; the FEC page for 2012 ↗ - 2014: fe2014.xls ↗, SHA-256
2a3105404ce922024583f4b3c2e844bab0d7d54054227b9b11797d4e7433e349; the FEC page for 2014 ↗ - 2016: fe2016.xlsx ↗, SHA-256
b4a1d1383602bc388cfbdf1fbea2476476d32e0b44b44236d3a3910fa9782eb6; the FEC page for 2016 ↗ - 2018: fe2018.xlsx ↗, SHA-256
f2c42311862b4927df2ca5908c5f9c8f8da6221a8db88fd00434a22ec1e0e303; the FEC page for 2018 ↗ - 2020: fe2020.xlsx ↗, SHA-256
5073b6d2c76c86c941508dfb1a11cc497e8529b0068c5132aceb0f385c19352e; the FEC page for 2020 ↗ - 2022: fe2022.xlsx ↗, SHA-256
cdb258ea23803e50d752bcea19faa39b3c201eb960094bcb556c3a38c2350897; the FEC page for 2022 ↗
Source for 1920, 1922, 1924, 1926, 1928, 1930, 1932, 1934, 1936, 1938, 1940, 1942, 1944, 1946, 1948, 1950, 1952, 1954, 1956, 1958, 1960, 1962, 1964, 1966, 1968, 1970, 1972, 1974, 1996, 1998, 2000, 2002, 2024: Clerk of the House of Representatives, Statistics of the Presidential and Congressional Election ↗, the PDF the Clerk publishes for each election (U.S. federal government work; no license text on the Clerk pages). Fetched and checked November 5, 2026. The PDFs were read into one flat file; its SHA-256 is 890fe7e3ada3a04ec96bde2fd9a2dd0f9e76371eeb5f328c1b4adbf90ca37563. Where the Clerk prints a total that does not equal its own candidate lines, both are kept as printed and the race is flagged.
Each year's PDF
- 1920: the Clerk's PDF ↗, 21 pages, SHA-256
5743a4dc705e870d8ac2c122ef024c338794a50f86b00e6d991bba4d45ce89a8 - 1922: the Clerk's PDF ↗, 17 pages, SHA-256
ffd4ba0212de312a3c38c0f9bcc58836a56c3ecf87e7ce3867797242d5140258 - 1924: the Clerk's PDF ↗, 23 pages, SHA-256
4c4e3e0e69de7ab0d56354ff854801bf4df3fb0ce04a5751c080bbc7080d4291 - 1926: the Clerk's PDF ↗, 24 pages, SHA-256
9ddd363cc3ad390d46d6f33fad060f556517e356f9d75e9c28e6b55293b39366 - 1928: the Clerk's PDF ↗, 38 pages, SHA-256
f2db273fe736383d9e85a1e205e2cc6e57655759f0c11bc7178affd6f8b51b3d - 1930: the Clerk's PDF ↗, 31 pages, SHA-256
f573ce53deee9a29884f9a0ad93c72dc20b3a340001a56bd4fe867985b6c7e42 - 1932: the Clerk's PDF ↗, 43 pages, SHA-256
b28a55cbb94ee4a1103f03394d9a176145ffa2226dd00ecb3e698f7e5a8fb34c - 1934: the Clerk's PDF ↗, 38 pages, SHA-256
10f3e77477cce8201b070a75b20293221bc47a1e65bdd2ad0be3c62580bf8577 - 1936: the Clerk's PDF ↗, 43 pages, SHA-256
c24f201b5a77b2e705973ee641d88d3fa3fc4b1f344603c92d499e06b047485b - 1938: the Clerk's PDF ↗, 28 pages, SHA-256
f07c09f2f434d84e60912a4034e4e146bc710156a8862ed592fcefea3f9edede - 1940: the Clerk's PDF ↗, 39 pages, SHA-256
807bfcc928e5ddd9d41fc904021a958873211813141e34423b76b76bf396b9a0 - 1942: the Clerk's PDF ↗, 39 pages, SHA-256
48d27b1e1af0c0e24b75d5639ed02b64d8aa53689f2e2ec4ea9fabb25f9b02b3 - 1944: the Clerk's PDF ↗, 55 pages, SHA-256
26ac7068f9962c8d1259162c5a1998d12e4267100712e4aff86976e4b0b5d330 - 1946: the Clerk's PDF ↗, 46 pages, SHA-256
51b9f103ffed2eafd070f458eb6baf89bede2f90814dbf2180253e36626bb796 - 1948: the Clerk's PDF ↗, 53 pages, SHA-256
5a68f3a1558b8cb66fc30e80ae410ec42404526ac62fe5bd177e07908231c86e - 1950: the Clerk's PDF ↗, 43 pages, SHA-256
1d08ba968be04e85c3b49ca5df291202cae689a9a6946cc43556d3f80b68023a - 1952: the Clerk's PDF ↗, 57 pages, SHA-256
d463ab65a8a64abd09619caec5a64f8e73b2a0f039d75d5139a4368c8ae6e4a3 - 1954: the Clerk's PDF ↗, 47 pages, SHA-256
0e48e4f7e65fba9e9083f1d07510fad4d7b0214214ff077606ea7acf5c1589dc - 1956: the Clerk's PDF ↗, 56 pages, SHA-256
8cd5ee1f7cf82a8678c4ba50ad459fc757facb198bd08d928e9f6e01cba5e323 - 1958: the Clerk's PDF ↗, 46 pages, SHA-256
8dd37d1af65a82bb74e15e5cb9a8f2fd8c1622b03260025e07d8fc8f94e7a214 - 1960: the Clerk's PDF ↗, 55 pages, SHA-256
8fecd0f95cefae1c5a337c362b9e6cbcbcc247a6a56dbeead2439b66f9dcb555 - 1962: the Clerk's PDF ↗, 47 pages, SHA-256
e821448f48e99da3b333e57488242201354fd7a4c0a378f8a53285ce5ca2929f - 1964: the Clerk's PDF ↗, 57 pages, SHA-256
0acfe227643d4ef98872b33a4d111fe614d97b04d9cf3e1279cf8c1c87d65cfd - 1966: the Clerk's PDF ↗, 52 pages, SHA-256
aec363c37e6d15742f91e3545f99508eda507c8aff57dea923f08ff2c923330c - 1968: the Clerk's PDF ↗, 57 pages, SHA-256
0d85f20859a2c5308d9106f4da942ad2161eafbb6b2b5e3d5e30ae757138f58d - 1970: the Clerk's PDF ↗, 43 pages, SHA-256
2f60f275ddca0efea603f4b990f0dcff2064cc6f8df1c22569541540fc7e3fd7 - 1972: the Clerk's PDF ↗, 56 pages, SHA-256
154ec5627a2ad3bd7d914af246fc3306f974f4fdf9e01405cb7d6c40c9649be6 - 1974: the Clerk's PDF ↗, 47 pages, SHA-256
5903a8a73acd03f1679bdf92db418488ecf3bb99109b9d143aa3010e59d5d15d - 1996: the Clerk's PDF ↗, 84 pages, SHA-256
1ae69aa0ab102a8eedaf1a5b002d13b3cff24e42c0c187fd08f54a3e0a5aa32f - 1998: the Clerk's PDF ↗, 53 pages, SHA-256
4424a7d1a5954439ffb09f1de5f11a45fe06c6cc7cd2885c7e7beb0ee4ff4b58 - 2000: the Clerk's PDF ↗, 80 pages, SHA-256
358230d84d1c9d85d859e9f311b1f994b6646c0f51da1967bec490a0cfd4d975 - 2002: the Clerk's PDF ↗, 55 pages, SHA-256
e041d83ff1dc4230e2d57b0f83234e63e51ed9f1624a1013af534628549e1060 - 2024: the Clerk's PDF ↗, 87 pages, SHA-256
d4ba800fc17135b616ae556c92861080ab962d95916ace34b546c5aac824aec4
Source for 1976 to 1994: MIT Election Data and Science Lab, U.S. House of Representatives 1976-2024 (Harvard Dataverse, doi:10.7910/DVN/IG0UN2), compiled from the Clerk of the House's Statistics of the Congressional Election ↗, CC0 1.0, version 15.0, released March 9, 2026. Downloaded and checked November 2, 2026. File SHA-256 76eec42483ee9f0fc5cf6e377442c783d1ae6eefa929729fd6561a69bab47f2a. The lab is the compiler; the original source is the Clerk of the U.S. House of Representatives, Statistics of the Congressional Election ↗.
Check run on all 18,152 races with a total to check against: the candidate rows add up to the source's own total in 18,082. The 70 that do not are flagged where they appear.